Key Takeaways
- Core content types (listicles, category hubs, how-to docs, product pages) account for 45-50% of citations and show only 2-5x variation across industries—not enough to warrant separate strategies.
- Niche formats (API docs, competitor pages, calculators/tools) show extreme variation (13-235x) but represent tiny citation percentages (0.01-2%).
- ChatGPT is the most consistent platform across industries (44.6% CV), Claude the most variable (147.9% CV).
- Your industry isn’t special to AI platforms. Proven tactics transfer universally.
I’m currently in the middle of analyzing 282 million AI platform citations across 18 industries and 8 LLMs.
This is the first post in a series unpacking how AI platforms work. Not how we think they work or how they say they work, but their actual, measurable patterns.
The first question I wanted to explore was do platforms behave differently depending on what industry you’re asking them about? For instance, do healthcare queries pull different content types than technology queries? Does financial services show different citation patterns than agriculture?
→ If yes, every industry would need its own playbook. Tactics for SaaS wouldn’t transfer to Manufacturing.
→ If not, proven strategies would be universal. The fundamentals that work in one vertical would work in yours too.
What I found: Platform personalities are remarkably consistent across industries for the content types that account for most citations. Listicles, category hubs and how-to documentation show modest variation across industries (2-3x differences between highest and lowest). Niche formats like API docs, competitor pages and calculators show extreme variation (13-48x differences).
Let’s take a deeper look.
The Nuts and Bolts
I calculated coefficient of variation (CV) scores for each content type on each platform across 18 industries.
What CV tells us:
- Low CV (<40%) = content type shows modest variation across industries → platform has consistent preferences
- High CV (>80%) = content type shows extreme variation by industry → industry-driven, not platform preference
For example:
ChatGPT cites listicles at 14% in Utilities and 31% in Communication, a 2.2x difference. The 24% CV indicates consistent platform behavior.
ChatGPT cites API docs at 0% in Agriculture and 0.3% in Technology, a 27x difference. The 115% CV indicates industry-driven behavior rather than platform preference.
Finding #1: Major Content Types are Consistent Across Industries
Listicles (CV: 24-29% across platforms)
- ChatGPT: 14% (Utilities) to 31% (Communication) = 2.2x difference
- Gemini: 16% (Agriculture) to 45% (Communication) = 2.8x difference
- Perplexity: 14% (Utilities) to 39% (Communication) = 2.8x difference
- Copilot: 17% (Utilities) to 38% (Communication) = 2.3x difference
This is a modest variation. Yes, Communication gets more listicles than Utilities, but we’re talking about a 2-3x range and not a 10x or 20x difference. We can therefore conclude that the format works everywhere.
Gemini cites listicles 1.4x more than ChatGPT does (30% vs 21% average) and that preference holds across every vertical. Platform personality persists.
Category Hubs (CV: 23-39%)
- ChatGPT: 5.7% (Technology) to 13.9% (Financial Services) = 2.4x difference
- Gemini: 4.7% (Communication) to 14.6% (Financial Services) = 3.1x difference
- Perplexity: 5.0% (Utilities) to 15.7% (Financial Services) = 3.1x difference
- Copilot: 6.4% (Consumer Goods) to 23.4% (ESG) = 3.7x difference
Category hubs maintain relatively stable citation rates. Financial Services consistently shows higher citations across all platforms (13-23%), while Technology/Consumer Goods trends lower (5-6%).
But the variation is modest; a 2-4x range means category hubs work in every industry, just slightly more in some than others.
How-to Documentation (CV: 30-37%)
- ChatGPT: 4.4% (Consumer Goods) to 12.6% (Entrepreneurship) = 2.9x difference
- Gemini: 4.0% (Agriculture) to 10.1% (Communication) = 2.5x difference
- Perplexity: 2.4% (Consumer Goods) to 8.4% (Business) = 3.5x difference
- Copilot: 2.0% (Utilities) to 6.6% (Technology) = 3.4x difference
ChatGPT shows the strongest preference for instructional content at 7% average. That educational bias holds across all industries, with modest 2.9x variation from lowest to highest.
Product Pages (CV: 41-44%)
- ChatGPT: 2.1% (Utilities) to 10.1% (Business) = 4.7x difference
- Gemini: 1.4% (Communication) to 7.9% (Financial Services) = 5.8x difference
- Perplexity: 1.8% (Entrepreneurship) to 10.7% (Consumer Goods) = 5.8x difference
- Copilot: 0.4% (Entrepreneurship) to 8.3% (Consumer Goods) = 20.5x difference
Product pages show more variation than listicles/category hubs, but still work across industries. The 5-6x differences mean product page optimization matters everywhere, just somewhat more in Consumer Goods and Financial Services.
Together, these four content types account for 45 to 50% of all citations. And they show the most consistent behavior across industries.
Finding #2: Niche Content Types are More Industry-Driven
Some content types show extreme variation across industries. While interesting, do notice the absolute citation rates: we’re talking about 0.01% to 2% at best.
API Documentation (CV: 112-133%)
- ChatGPT: 0% (Agriculture) to 0.3% (Technology) = 27x difference
- Gemini: 0% (most industries) to 0.2% (Technology) = 29x difference
- Perplexity: 0% (most industries) to 0.3% (Technology) = 49x difference
API docs essentially don’t exist outside Technology contexts. This is pure industry-driven behavior and platforms cite what’s available and relevant.
Competitor Pages (CV: 70-113%)
- ChatGPT: 0% (Agriculture) to 0.3% (Communication) = 13x difference
- Gemini: 0% (many industries) to 0.2% (Technology) = 22x difference
- Perplexity: 0% (many industries) to 0.2% (Technology/Communication) = 12x difference
Competitor comparison pages work in industries with obvious competitive landscapes (Technology, Communication, Business). In fragmented or commodity markets, it makes sense that they barely show up.
Calculator/Tools (CV: 93-123%)
- ChatGPT: 0.1% (most industries) to 1.4% (Technology) = 17x difference
- Gemini: 0.1% (Hospitality) to 1.8% (Technology) = 30x difference
- Perplexity: 0.1% (Consumer Goods) to 2.8% (Technology) = 37x difference
- Copilot: 0% (many industries) to 5.1% (Technology) = 235x difference
Interactive tools, calculators and widgets get cited heavily in Technology (2-5% on some platforms) but barely register elsewhere (0.1% or less).
Case Studies (CV: 33-97%)
- ChatGPT: 0.3% (Education) to 1.0% (Consumer Goods) = 3.6x difference
- Gemini: 0.2% (Financial Services) to 1.1% (Consumer Goods) = 5.8x difference
- Perplexity: 0.1% (Utilities) to 0.6% (ESG/Hospitality) = 4.5x difference
- Copilot: 0% (many industries) to 1.4% (Consumer Goods) = 33x difference
Consumer Goods and ESG show higher case study citations (0.6-1.4%), while Financial Services and technical industries trend lower (0.1-0.3%).
These formats show extreme variability (13-235x differences), but they’re very small percentages. Even at peak performance in Technology, API docs get 0.3% citations, Calculators max out at 2-5% and case studies cap at 1.4%.
Compare that to listicles (14-45%) or category hubs (5-23%). The consistent formats dominate by volume.
How This Impacts Your GEO Strategy
Platforms don’t treat your industry as special. If you’re building content for AI visibility, the priority is the same regardless of whether you’re in Healthcare, Finance or Technology:
- Strong listicles (20-30% of citations, 2-3x variation by industry)
- Comprehensive category hubs (9-11% of citations, 2-4x variation)
- Quality how-to documentation (4-7% of citations, 2-4x variation)
- Optimized product pages (4-6% of citations, 5-6x variation)
In practice:
- If you’re in a less-established vertical (Agriculture, Materials, Utilities), you’re not at a disadvantage. Platforms cite the same content types in your industry as they do in Technology or Consumer Goods. Build strong listicles and they’ll perform.
- If you’re in a competitive vertical (Technology), you’re not up against unique citation patterns. Build the same core content types that work elsewhere, just execute them better than your competitors.
- If you’re wondering whether your industry needs a “special approach” to AI optimization, rest assured it doesn’t. The fundamentals are universal.
The exceptions:
- If you’re in Technology, niche formats (API docs, feature pages, calculators) get 5-50x more citations than in other industries. But even at peak, they’re 0.3-5% of total citations. Core content types still dominate.
- If you’re in Consumer Goods, case studies perform 3-6x better (up to 1.4% vs 0.2-0.4% elsewhere).
- If you’re in Financial Services, category hubs get cited 2-3x more (14-23% vs 5-10% elsewhere). This is the most meaningful industry-specific lift I found.
Still, notice that these are incremental advantages. The content type hierarchy remains consistent everywhere.
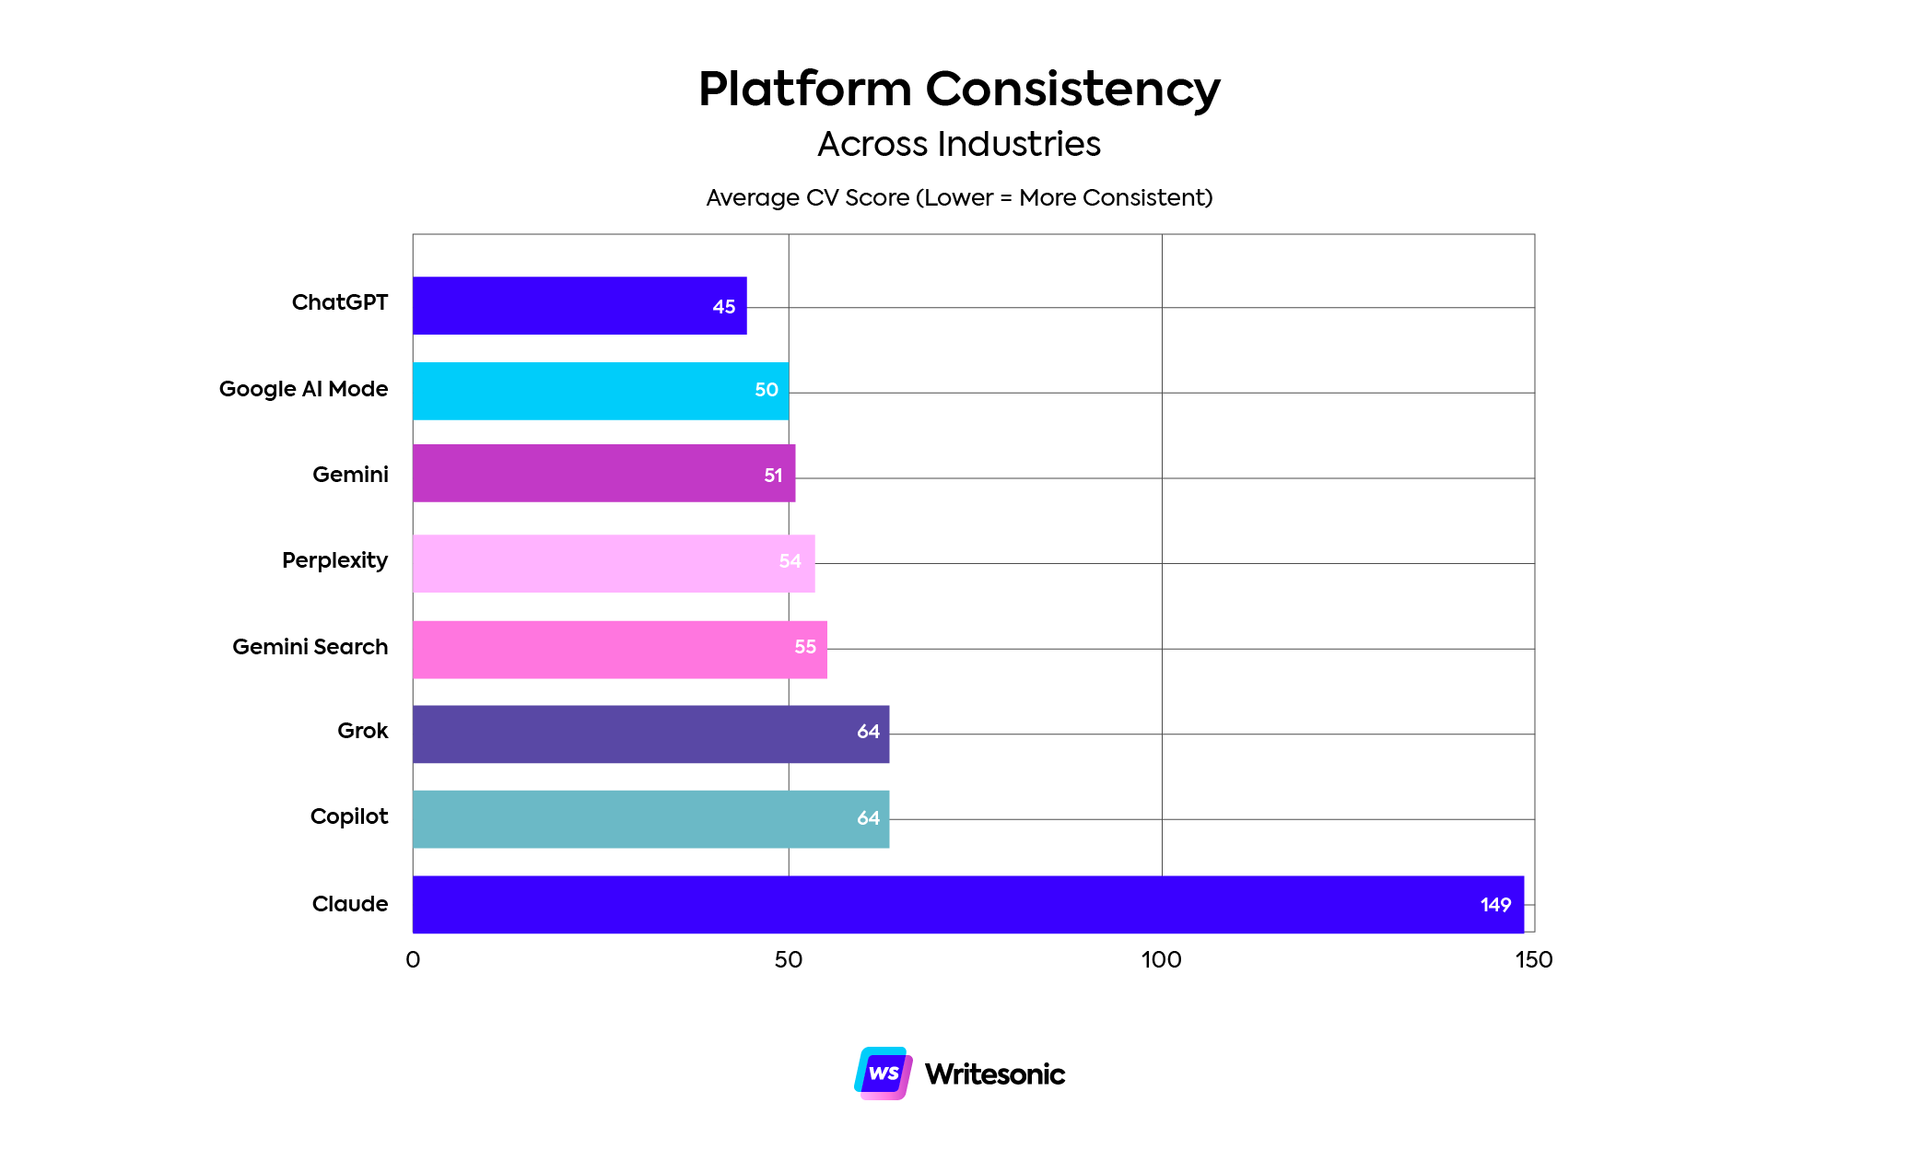
Platform Consistency Scores
I averaged the CV scores across all content types for each platform to measure overall consistency:
- ChatGPT Plus/Pro: 44.6% average CV (most consistent)
- Google AI Mode: 50.3%
- Gemini: 50.7%
- Perplexity: 53.5%
- Gemini Search: 55.1%
- Grok: 64.1%
- Copilot: 64.4%
- Claude 4: 147.9% (most variable)
ChatGPT maintains the most consistent citation behavior across industries. Its preferences shift modestly (2-3x for core content types) but predictably.
Claude is the outlier. Its 147.9% average CV suggests it adapts significantly to industry context. Due to fewer Claude citations in our dataset, this could be a sample size artifact or genuine adaptive behavior.
Most platforms fall in the 50-65% range, so moderately consistent, with core content types showing 2-5x variation and niche formats showing 10-50x variation.
What I’m Not Saying
Industry expertise absolutely matters, arguably more than it does for SEO. You still need to understand your audience, use correct terminology, address industry-specific pain points and provide relevant examples. A generic listicle written by someone who doesn’t understand your space won’t perform well on any discovery surface.
What I’m saying is that the format that gets cited doesn’t change by industry. Platforms favor listicles whether you’re writing about accounting software or agricultural equipment. They cite category hubs in Healthcare the same way they cite them in Hospitality. The content type preferences show modest (2-5x) variation, not fundamental restructuring.
Your competitive advantage comes from:
- Better execution of universal formats
- Deeper industry knowledge
- More accurate information
- More relevant examples
Not from discovering some secret content format that only works in your vertical.
Methodology note: Analysis based on 282,828,738 citations from 8 AI platforms across 18 industries. CV scores calculated as (standard deviation / mean) × 100 for each content type’s citation share across industries. Lower CV = more consistent across industries. Ranges show minimum and maximum citation rates observed across 18 industries.
Content Marketer
Mariana is a creator and strategist making ICPs, CEOs, SERPs, LLMs (and many other acronyms) happy all at once. Over the past seven years, she's designed, deployed and scaled content programs that deliver measurable growth for B2B and B2C brands alike.
Quality-first (always), AI-curious (not AI-dependent) and just the right amount of stubborn about what makes content worth reading.