Key Takeaways
- Listicles win regardless of query type. 20-32% citation share across every frame tested. Troubleshooting queries show the lowest listicle performance (19.74%), and that’s still nearly 1 in 5 citations.
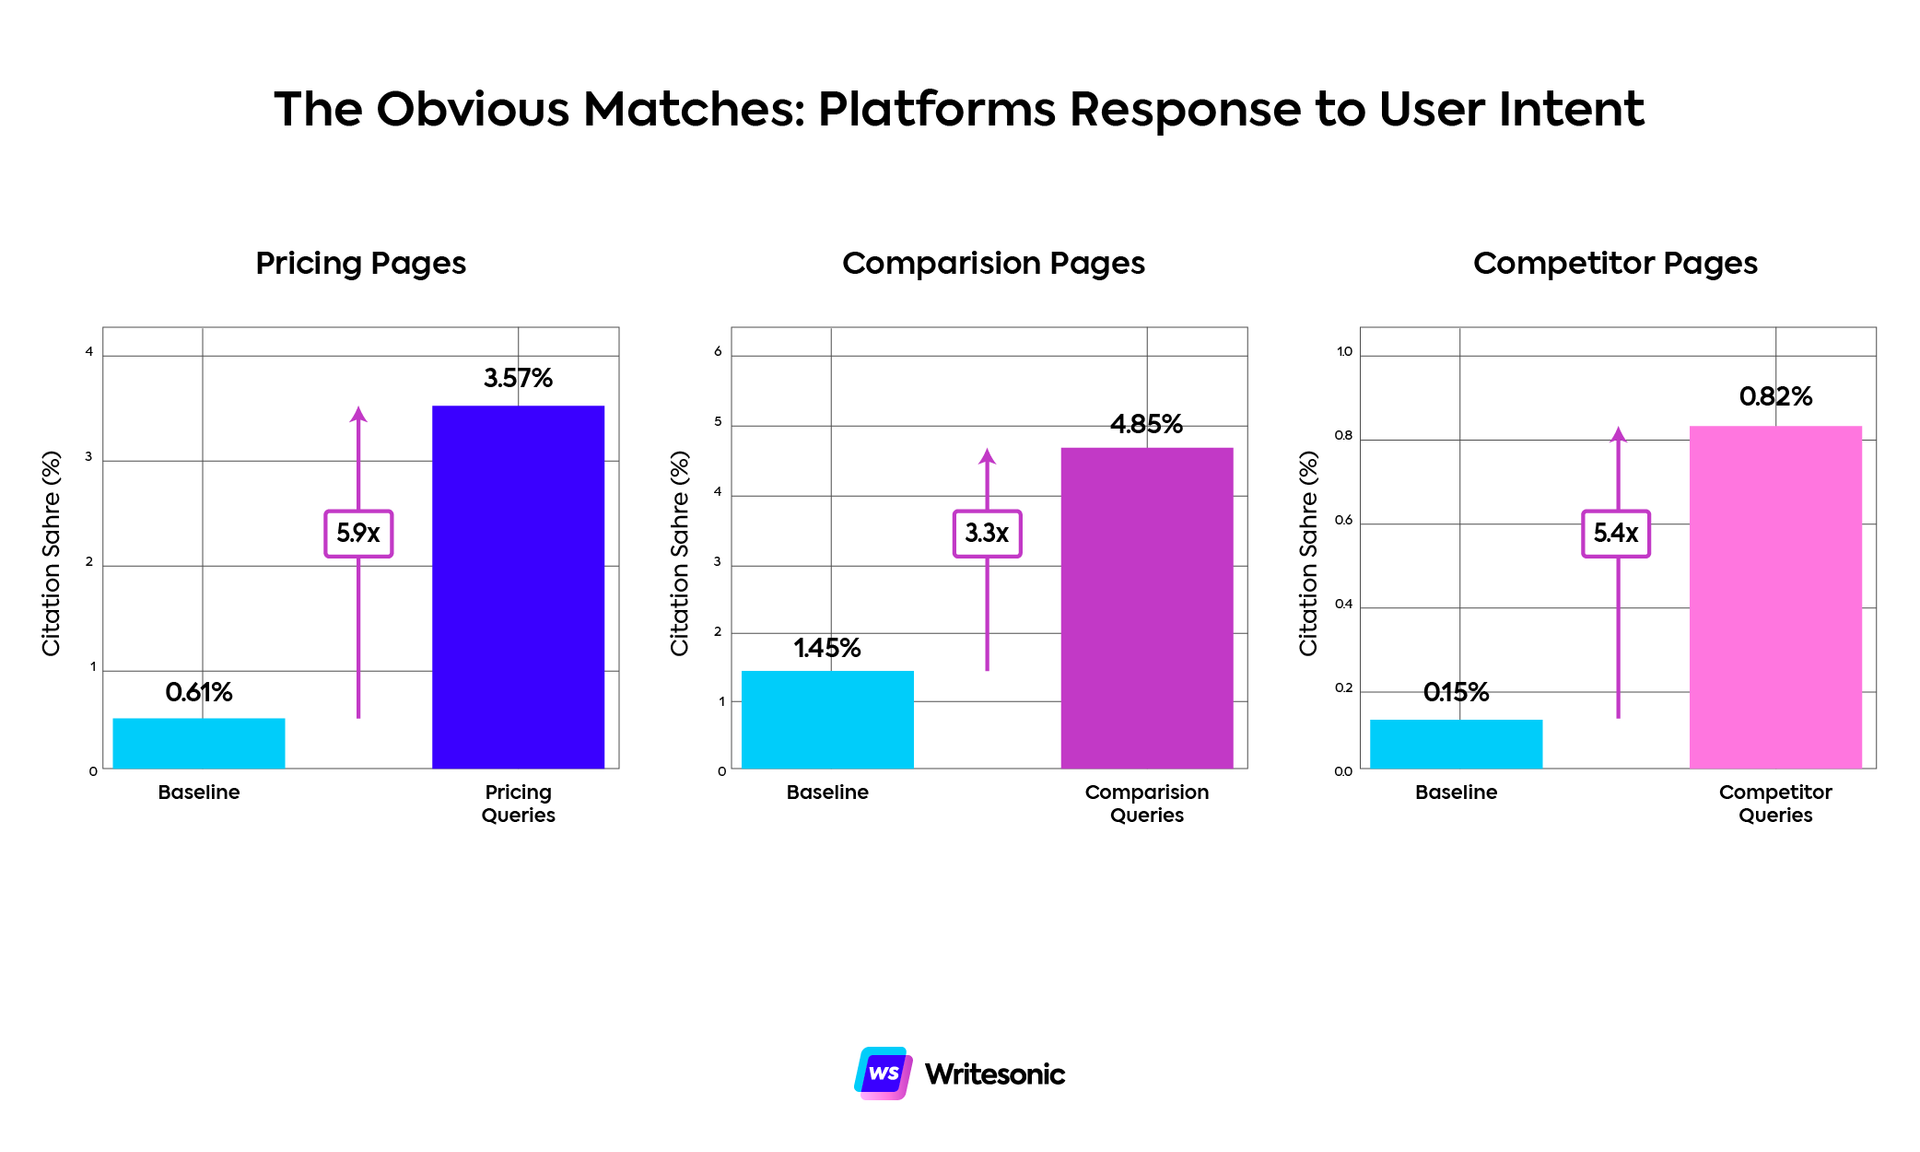
- Intent matching works, but it’s not surprising. Pricing queries pull pricing pages 5.88x more than baseline. Comparison queries pull comparison content 3.34x more. Alternatives queries surface competitor pages 5.37x more. Platforms respond to explicit intent signals the way you’d expect.
- Reviews explode in troubleshooting contexts. 8.9x lift—the most extreme multiplier in the dataset. Reviews jump from <1% to 7.87% of citations when users search for fixes and bugs. Likely explanation: reviews mention problems users encountered, and platforms match those snippets to troubleshooting queries even though reviews don’t actually solve anything.
- Product pages beat pricing pages in pricing queries. Pricing pages get a 5.88x lift, but product pages still capture more total citations (8.64%). Platforms prefer comprehensive context over isolated pricing information.
Welcome back to our AI search lab. Last time, I analyzed LLM citation patterns in branded vs. non-branded prompts. This week, I wanted to find out whether divergence in query framing—how to do X, Product A vs Product B, what is Y, best tools for Z—produces meaningful changes in what gets cited.
The data landed somewhere between “mostly predictable” and “why is that happening?”
The assumption going in was that platforms would heavily adjust citation patterns based on intent. If someone’s asking how to do something, they’d prioritize tutorials. If someone’s comparing products, they’d surface comparison content. Basic intent matching.
The reality is more subtle than that. Grab some coffee while I break down the best insights and what they mean for your GEO strategy.
Finding #1: Listicles stay dominant everywhere
Listicles account for 20-32% of citations across all query types. That’s a 1.6x range, which is basically nothing compared to most content types.
- What is queries: 31.79%
- List/best queries: 32.05%
- Comparison queries: 30.06%
- Alternatives queries: 28.48%
- How-to queries: 27.50%
- Pricing queries: 25.54%
- Troubleshooting queries: 19.74%
Even in troubleshooting contexts, where listicles perform worst, they still capture nearly 20% of citations. This matches what we saw in the industry analysis and the branded query study: listicles work everywhere. Query framing changes a lot of things, but it doesn’t dethrone listicles as the format platforms default to.
This is good news if you’re already publishing them. It’s also confirmation that you can’t ignore them just because your vertical feels “different.”
Finding #2: The obvious matches are mostly what you’d expect
Platforms are reasonably good at matching content to explicit intent.
- Pricing queries pull pricing pages 5.88x more than baseline (0.61% → 3.57%)
- Comparison queries pull comparison pages 3.34x more (1.45% → 4.85%)
- Alternatives queries pull competitor pages 5.37x more (0.15% → 0.82%)
These aren’t shocking revelations, but they’re worth confirming. When users explicitly signal their intent, platforms respond accordingly. If someone searches “Writesonic pricing,” they’re getting pricing pages. If they search “Writesonic alternatives,” they’re getting competitor comparison content.
The lifts are consistent across platforms too.
Finding #3: Reviews explode 8.9x in troubleshooting queries
Reviews account for less than 1% of citations in most contexts (0.88% baseline). In troubleshooting queries, they jump to 7.87%.
That’s an 8.9x lift and the most extreme multiplier in the entire dataset.
When users search “why isn’t Slack loading my messages” or “Zoom freezing during calls,” platforms prioritize review content over nearly everything else. Reviews jump from less than 1% of citations to almost 8%.
This doesn’t make obvious sense. Reviews aren’t troubleshooting guides, they’re product evaluations. Why would they be relevant when someone’s trying to fix a problem?
A possible explanation (and my best guess) is that reviews often mention bugs, issues and problems users encountered. If someone leaves a review saying “great product but crashes on mobile” or “love it except for the sync issues,” that content might match troubleshooting queries. Platforms could be pulling review snippets where users describe similar problems, even if those reviews don’t provide solutions.
But that’s just a hypothesis.
Other troubleshooting lifts:
- FAQ pages: 2.83x
- Case studies: 2.07x
- Press releases: 1.82x
The FAQ lift makes sense as they address common issues. Press releases might surface because companies announce patches and fixes. But as for why case studies lift 2x in troubleshooting contexts, that’s another interesting conundrum.
What’s undeniable is the review lift. Whether that’s good content matching or platforms struggling to find actual troubleshooting guides is an open question.
Finding #4: How-to queries favor instructional formats
How-to queries show the expected preferences for educational content.
- FAQ pages: 1.76x lift (0.43% → 0.75%)
- API documentation: 1.60x lift (0.15% → 0.24%)
- How-to docs: 1.39x lift (6.66% → 9.22%)
Nothing wild here. Platforms distinguish between “teach me” and “help me decide” intent. How-to queries suppress comparison pages (0.20x), competitor pages (0.14x) and reviews (0.30x).
Finding #5: Pricing queries surface product pages over pricing pages
Pricing pages get a 5.88x lift in pricing queries (0.61% → 3.57%), which makes sense. But product pages get cited at 8.64% in pricing contexts, significantly outperforming dedicated pricing pages.
We’re seeing a similar pattern as we did back with branded vs non-branded queries. In contexts where you’d assume pricing pages to be the go-to choice (branded prompts and pricing queries), LLMs prefer comprehensive product pages with context, feature explanations and pricing together rather than pricing in isolation.
Meanwhile, competitor pages don’t move in comparison queries (0.17% baseline → 0.17%). You’d think “Slack vs Teams” would prioritize dedicated competitor comparison pages, but platforms prefer broader comparison pages (4.85%) that analyze multiple options rather than binary matchups.
Platform biases are there but they don’t dominate
Most platforms follow similar patterns, but a few show distinct preferences.
Claude over-indexes on competitor pages
Competitor pages get 4.08x over-representation in what-is queries and 3.87x in list queries on Claude. When users ask “what is Writesonic” or “best project management tools,” Claude disproportionately pulls competitor comparison content.
ChatGPT prefers case studies
Case studies get 1.66-1.80x over-representation across multiple frame types on ChatGPT. No other platform shows this preference. If you’re publishing case study content, ChatGPT is your best distribution channel within AI search.
Grok favors aggregator roundups
Grok cites aggregator roundups 1.57-2.00x more than average across nearly all query types.
Suppressions are bigger than lifts
Some content types get suppressed in specific contexts:
- How-to queries crush comparison pages (0.20x) and competitor pages (0.14x). If users ask instructional questions, competitive content takes a hit.
- Troubleshooting queries suppress listicles (0.65x), comparison pages (0.58x), and competitor pages (0.19x). Problem-solving intent impacts evaluation content citations.
- Pricing queries suppress case studies (0.48x) and competitor pages (0.60x). Users looking at pricing don’t want narrative examples or competitive analysis.
These suppressions are often larger than the lifts. Comparison pages drop to 0.29% in how-to contexts from 1.45% baseline. That’s a 0.20x multiplier and far more dramatic than most positive lifts.
Intent-based optimization works in AI search the same way it works in SEO. Users signal what they want, platforms attempt to match that intent and specific content formats perform better in specific contexts.
Methodology: Analysis based on 282,828,738 citations across 7 frame types (what is, how-to, comparison, pricing, alternatives, troubleshooting, list/best) and 16 content types. Lift calculated as (frame % / baseline %) where baseline represents average citation rate across all frames. Platform biases calculated as (platform % / average %) for each frame-content combination.
Content Marketer
Mariana is a creator and strategist making ICPs, CEOs, SERPs, LLMs (and many other acronyms) happy all at once. Over the past seven years, she's designed, deployed and scaled content programs that deliver measurable growth for B2B and B2C brands alike.
Quality-first (always), AI-curious (not AI-dependent) and just the right amount of stubborn about what makes content worth reading.